Difference between revisions of "Big Data"
(→What is Big Data) |
(→TRC PowerPoint) |
||
| (8 intermediate revisions by the same user not shown) | |||
| Line 4: | Line 4: | ||
* '''variety''': the type of data being collected is wide-ranging, varied and may be difficult to classify. | * '''variety''': the type of data being collected is wide-ranging, varied and may be difficult to classify. | ||
* '''velocity''': the data changes quickly and may include constantly changing data sources. | * '''velocity''': the data changes quickly and may include constantly changing data sources. | ||
| + | |||
| + | <youtube>https://www.youtube.com/watch?v=qGNikQCkNWU&index=169&list=PLCiOXwirraUDUYF_qDYcZV8Hce8dsE_Ho</youtube> | ||
| + | |||
| + | https://www.youtube.com/watch?v=qGNikQCkNWU&index=169&list=PLCiOXwirraUDUYF_qDYcZV8Hce8dsE_Ho | ||
==Where is Big Data Used== | ==Where is Big Data Used== | ||
| Line 17: | Line 21: | ||
==Big Data & Latency== | ==Big Data & Latency== | ||
| − | Latency is the time delay | + | Latency is critical here and could be described as the time delay of the amount of time it takes to turn the raw data into meaningful information. With big data there may be a large degree of latency due to the amount of time taken to access and manipulate the sheer number of records. |
| + | |||
| + | ==Machine Learning== | ||
| + | Quantitative data can be stored in standard relational databases, it makes it relatively simple to query the data to provide results. Even on a large database this could be done accurately and relatively quickly. | ||
| + | |||
| + | Qualitative data can be stored in a database but it is much harder to analyse or query. Also qualitative data is more likely to be unstructured, so you could end up with just a table of possibly incomplete data. For example, if an online retailer asks for feedback in the form of customer comments they could receive millions of items of data. It would essentially require a team to read each comment and categorize it, is it positive, negative or neutral. Just imagine if you wanted to get more from this. | ||
| + | |||
| + | Machine learning can be used to automate this process, it covers everything from pattern matching to artificial intelligence. At a simple level the machine could look for patterns of words within the comment to determine the nature of the feedback. It could be programmed with the words and phrases to look for. This could be developed to also include some understanding of how the words are used. | ||
| + | |||
| + | More advanced machine learning is where the computer is able to develop its own knowledge based on the data it is manipulating. This often allows big data to identify none obvious patterns and correlations in the data. | ||
| + | |||
| + | ==Big Data Issues== | ||
| + | #Datasets are so large they are too difficult to store and analyse | ||
| + | #Unstructured data difficult to analyse in an automated way | ||
| + | #Specialist software needed to manage & extract info from the data | ||
| + | #Massive storage and processing power need | ||
| + | #Data is constantly changing, difficult to track every change | ||
| + | #Possible to infer the wrong conclusion from the data | ||
| + | #Concurrency where several users working at same time | ||
| + | |||
| + | =Modelling Big Data= | ||
| + | <youtube>https://www.youtube.com/watch?v=GHmXhaxmXHI&index=167&list=PLCiOXwirraUDUYF_qDYcZV8Hce8dsE_Ho</youtube> | ||
| + | |||
| + | https://www.youtube.com/watch?v=GHmXhaxmXHI&index=167&list=PLCiOXwirraUDUYF_qDYcZV8Hce8dsE_Ho | ||
| + | |||
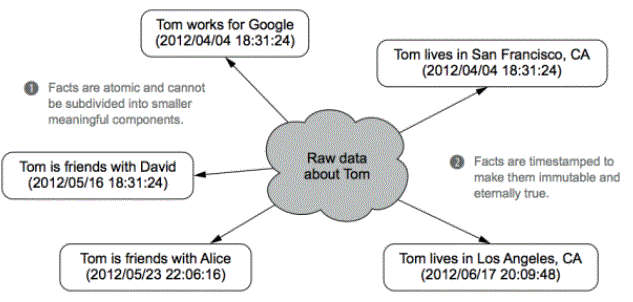
| + | ==Fact based modeling== | ||
| + | *Identify fundamental facts within the data | ||
| + | *This identifies all of the entities within the data | ||
| + | *We have sold 1000 cars | ||
| + | |||
| + | for example: | ||
| + | |||
| + | [[File:Factbasedmodelbigdata.gif]] | ||
| + | |||
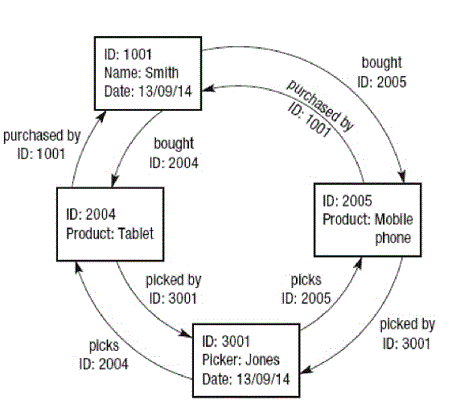
| + | ==Graph Schema (database)== | ||
| + | *Method of defining a database in terms of nodes, edges, & properties | ||
| + | *Nodes are entities, properties are information stored within entity | ||
| + | *Edges are relationships between 2 nodes | ||
| + | |||
| + | for example: | ||
| + | |||
| + | [[File:Bigdatagraphschema.gif]] | ||
| + | |||
| + | In this diagram each Node is an entity, picker, customer, product. <br> | ||
| + | In this diagram each Property is relevant data such has product name. <br> | ||
| + | In this diagram each Edge shows link / relationship between entities. <br> | ||
| + | |||
| + | =Distributed Processing= | ||
| + | The principle of spreading large and complex tasks over a number of computers or servers. This is because big data is often so big you can’t store all of the data onto a single machine or analyse it quickly enough. | ||
| + | |||
| + | Work is therefore spread over many servers or workstations over a network, distributing the processing between the processors of each. A dedicated network is set up to work on a task. One machine will be allocated as the master computer, this will control the others via the operating system and specialised software. Each machine has its own subtask, & messages are passed between machines in order to meet overall goal. | ||
| + | |||
| + | <youtube>https://www.youtube.com/watch?v=sDUVYO7-CpM&index=168&list=PLCiOXwirraUDUYF_qDYcZV8Hce8dsE_Ho</youtube> | ||
| − | + | https://www.youtube.com/watch?v=sDUVYO7-CpM&index=168&list=PLCiOXwirraUDUYF_qDYcZV8Hce8dsE_Ho | |
Latest revision as of 07:44, 23 August 2023
Contents
What is Big Data
Big data is a generic term given to datasets that are so large or complicated that they are difficult to store, manipulate and analyse. The three main features of big data are:
- volume: the sheer amount of data is on a very large scale
- variety: the type of data being collected is wide-ranging, varied and may be difficult to classify.
- velocity: the data changes quickly and may include constantly changing data sources.
https://www.youtube.com/watch?v=qGNikQCkNWU&index=169&list=PLCiOXwirraUDUYF_qDYcZV8Hce8dsE_Ho
Where is Big Data Used
Big data is used for different purposes. In some cases, it is used to record factual data such as banking transactions. However, it is increasingly being used to analyse trends and try to make predictions based on relationships and correlations within the data. Big data is being created all the time in many different areas of life. Examples include:
- scientific research
- retail
- banking
- government
- mobile networks
- security
- real-time applications
- the Internet.
Big Data & Latency
Latency is critical here and could be described as the time delay of the amount of time it takes to turn the raw data into meaningful information. With big data there may be a large degree of latency due to the amount of time taken to access and manipulate the sheer number of records.
Machine Learning
Quantitative data can be stored in standard relational databases, it makes it relatively simple to query the data to provide results. Even on a large database this could be done accurately and relatively quickly.
Qualitative data can be stored in a database but it is much harder to analyse or query. Also qualitative data is more likely to be unstructured, so you could end up with just a table of possibly incomplete data. For example, if an online retailer asks for feedback in the form of customer comments they could receive millions of items of data. It would essentially require a team to read each comment and categorize it, is it positive, negative or neutral. Just imagine if you wanted to get more from this.
Machine learning can be used to automate this process, it covers everything from pattern matching to artificial intelligence. At a simple level the machine could look for patterns of words within the comment to determine the nature of the feedback. It could be programmed with the words and phrases to look for. This could be developed to also include some understanding of how the words are used.
More advanced machine learning is where the computer is able to develop its own knowledge based on the data it is manipulating. This often allows big data to identify none obvious patterns and correlations in the data.
Big Data Issues
- Datasets are so large they are too difficult to store and analyse
- Unstructured data difficult to analyse in an automated way
- Specialist software needed to manage & extract info from the data
- Massive storage and processing power need
- Data is constantly changing, difficult to track every change
- Possible to infer the wrong conclusion from the data
- Concurrency where several users working at same time
Modelling Big Data
https://www.youtube.com/watch?v=GHmXhaxmXHI&index=167&list=PLCiOXwirraUDUYF_qDYcZV8Hce8dsE_Ho
Fact based modeling
- Identify fundamental facts within the data
- This identifies all of the entities within the data
- We have sold 1000 cars
for example:
Graph Schema (database)
- Method of defining a database in terms of nodes, edges, & properties
- Nodes are entities, properties are information stored within entity
- Edges are relationships between 2 nodes
for example:
In this diagram each Node is an entity, picker, customer, product.
In this diagram each Property is relevant data such has product name.
In this diagram each Edge shows link / relationship between entities.
Distributed Processing
The principle of spreading large and complex tasks over a number of computers or servers. This is because big data is often so big you can’t store all of the data onto a single machine or analyse it quickly enough.
Work is therefore spread over many servers or workstations over a network, distributing the processing between the processors of each. A dedicated network is set up to work on a task. One machine will be allocated as the master computer, this will control the others via the operating system and specialised software. Each machine has its own subtask, & messages are passed between machines in order to meet overall goal.
https://www.youtube.com/watch?v=sDUVYO7-CpM&index=168&list=PLCiOXwirraUDUYF_qDYcZV8Hce8dsE_Ho

